As a leading cement producer in the South Indian market, we are aware of the detrimental effects that cement manufacturing can have on the environment, both while drawing resources and while disposing the waste material. To mitigate the risks emerging from our operations, we have taken several proactive steps and have established a greener and sustainable operating environment for all.
Performing across relevant material matters

Climate and energy
Total energy consumption
Mattampally
Specific energy consumption
GHG emissions intensity
SOx emissions
NOx emissions
Gudipadu
Specific energy consumption
GHG emissions intensity
SOx emissions
NOx emissions
Bayyavaram
Specific energy consumption
GHG emissions intensity

Responsible consumption
Freshwater withdrawal
(Mattampally)
Waste heat recovered
Limestone mined

Waste management and circular economy
Wastewater recycled
Slag used in cement production
Fly ash consumed
Gypsum consumed

Green belt management
Green belt sites
Acreage of Green belt sites

Sustainable land use, relocation and rehabilitation (after mine closures)

Responsible sourcing and alternative raw materials
Maintaining our environmental commitments across areas

Raw material
We have deployed of state-of-the-art mining equipment for mineral extraction and development, which is done strictly in accordance to the mining plans and schemes approved by statutory authorities.
We use CBX and Ramco mine management software to blend various categories of low-grade limestone with high-grade limestone to conserve the mineral and ensure zero rejects from the mines. This is further supported by our use of high-grade coal, and pet coke which is used as a fuel for clinker manufacturing.

Biodiversity
At SCL, it is our priority to preserve the natural environment and the various ecosystems it supports. While operating our captive limestone mine, we remain mindful of following sustainable mining practices, including controlled blasting to reduce dust and noise and control our emissions. Further, we continue to work passionately to enhance the green spread in and around our quarry sites, manufacturing units, residential colonies and nearby villages by planting native and other floral species. As a result of our efforts, the area around our mines has become a preferred nesting and breeding habitat for migratory and local avifauna.
Our three-pronged strategy for biodiversity management

Energy
We have a two-fold approach to energy management and conservation:
A. We use diversified sources for energy generation to achieve energy security, minimise carbon footprint and achieve cost efficiency. Over 30% of our overall energy requirement is met from renewable sources and it is our priority to increase the proportion of renewables in our overall energy mix.
Source of energy
Installed capacity
Location
RENEWABLE
Solar
1.25 MW
Mattampally, Telangana
80 KW
Corporate office, Hyderabad, Telangana
120 KW
Bayyavaram
Hydro electric
4.3 MW
Guntur, Andhra Pradesh
4.0 MW
Kurnool, Andhra Pradesh
WHRS
8.8 MW
Mattampally, Telangana
Renewable total
18.55 MW
NON-RENEWABLE
Thermal
25 MW
Gudipadu, Andhra Pradesh
18 MW
Mattampally, Telangana
Non-renewable total
43 MW
TOTAL
61.55 MW
B. We achieve better energy savings as part of our efficiency improvement initiatives. Investments in technology and state-of-the-art equipment have helped us continuously improve our energy conservation over the years. For example, our Mattampally plant has a Dry Process Rotary Kiln, which uses one of the most energy-efficient technologies to run our cement making operations. [Read more on our various technology-led energy saving interventions on Technology adoption.

Emissions
As a cement manufacturer, we generate GHGs, dust and SOx and NOx. It is our constant endeavour to minimise these emissions. We are mindful to not only meet the prevalent emission standards, but to exceed compliance wherever possible. We have installed specific equipment and technology to control our emissions.
Our key interventions to control carbon emissions include:
Carbon emissions in the past three years
tCO2e
| Year | FY2020 | FY2019 | FY2018 |
| Scope 1 | 20,30,741 | 20,64,650 | 18,86,834 |
| Scope 2 | 74,012 | 1,09,666 | 1,11,103 |
| Scope 3 | 72,981 | 92,186 | 85,627 |
| Total | 21,77,734 | 22,66,503 | 20,83,564 |
We plan to reduce specific CO2 emissions by 15.00% by FY2023.
1.71 (Mattampally), 0.42 (Gudipadu)
Thermal substitution rate in FY2020
Our key interventions to control dust, NOx and SOx emissions include:
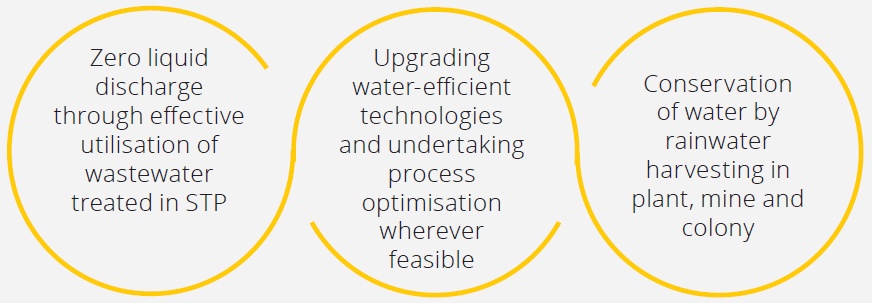
Water
We are on an expedited path to achieve water neutrality across all our locations, in line with our integrated water management plan.
100% of our industrial water requirements are met by harvested rainwater.
Our water management policy guides our interventions and we continue to undertake holistic initiatives to conserve and reuse water. Some of them include:
Water management at SCL
Source versus quantity of consumption of water
| Source of water | Quantity consumed in FY2020 (kL) | Quantity consumed in FY2019 (kL) | Quantity consumed in FY2018 (kL) |
| Harvested water | 1,34,390 | 1,80,051 | 1,68,850 |
| Bore well | 1,93,178 | 2,64,207 | 2,26,648 |
| Total water | 3,27,568 | 4,44,258 | 3,95,498 |
| Cement production | 30,44,236 | 32,54,038 | 26,45,677 |
| Specific water consumption (kL/t of cement) | 0.11 | 0.14 | 0.15 |

Waste management
Our highly efficient waste management system effectively manages both hazardous and non-hazardous waste produced by our operations. We also co-process waste from other industries in our cement kilns.
Our interventions to treat different waste categories are summarised below:
Solid waste
The solid waste generated during manufacturing is re-collected by means of RABH, Electrostatic Precipitator (ESP) and blast furnaces, and is then reinjected into the process to achieve resource conservation and reduced waste from plant.
Fly ash
Fly ash generated from CPP is used in PPC manufacturing. Other waste generated from plant maintenance such as used oil and metal scrap are disposed of in a responsible manner, complying with the regulatory guidelines.
Total hazardous waste disposed
| Type of waste | Unit | FY2020 | FY2019 | FY2018 | |
| Waste lubricants oil | Generated | l | 37,279 | 24,104 | 23,551 |
| Consumed | 28,879 | 13,544 | 17,960 | ||
| Sold | 8,400 | 15,460 | 5,590 | ||
| Waste grease with cotton waste | Generated | kg | 5,363 | 1,971 | 1,721 |
| Consumed | 1,403 | 1,971 | 1,721 | ||
| Sold | 3,960 | 0 | 0 | ||
| E-waste | Generated | kg | 231 | 1,250 | 213 |
| Disposed | 167 | 1,250 | 1,127 | ||
| kg (from the previous year) |
Total non-hazardous waste disposed
| Type of waste | Unit | FY2020 | FY2019 | FY2018 | Disposal mechanism |
| Metal scrap | T | 739.40 | 946.43 | 1347.31 | Sold to third party |
| Belt scrap | T | 60.24 | 16.30 | 7.14 | Sold to third party |
| Office, in-house packing and socked cotton | T | 9.62 | 8.70 | 6.60 | Processed in kiln |
| Tyre scrap | Units | 4 | 37 | 52 | Sold to third party |
| PP Scrap | T | 50.44 | 43.44 | 70.93 | Sold to third party |
Waste from other industries co-processed in FY2020 (T)
| FY2020 | FY2019 | FY2018 | |
| Spent carbon | 3,950 | 3,141 | 426 |
| Carbon black | 2,010 | 179 | - |
| Fly ash | 2,52,506 | 2,65,131 | 2,18,928 |
| Slag | 1,57,414 | 3,05,786 | 3,32,386 |
Effluents
At SCL, we strive for ‘Zero Discharge’ across all our operations and we do not discharge any process effluents to any water body. Complying with the new regulations, we are also in the process of installing new/upgrading existing STPs wherever necessary.
Waste-to-landfill
During the reporting period, both hazardous and non-hazardous waste were disposed of in a responsible manner and no hazardous waste was directed to landfill.