Financial and operational performance

Consistent and stable track record

Operational indicators

Cement production    (in T)

FY16
FY17
FY18
FY19
FY20

6%

y-o-y

9%

5-year CAGR

Clinker production    (in T)

FY16
FY17
FY18
FY19
FY20

5%

y-o-y

7%

5-year CAGR

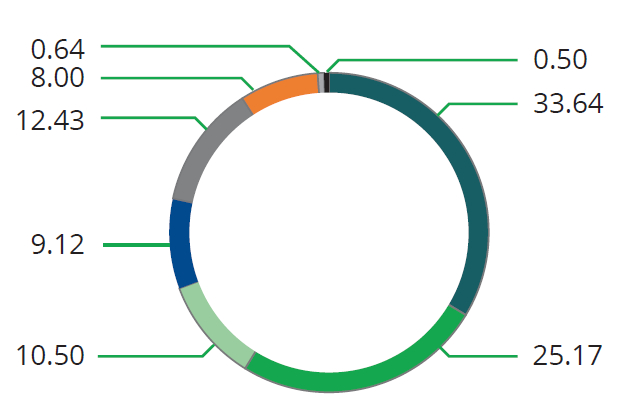
Region-wise sales FY2020    (%)

   (in T)

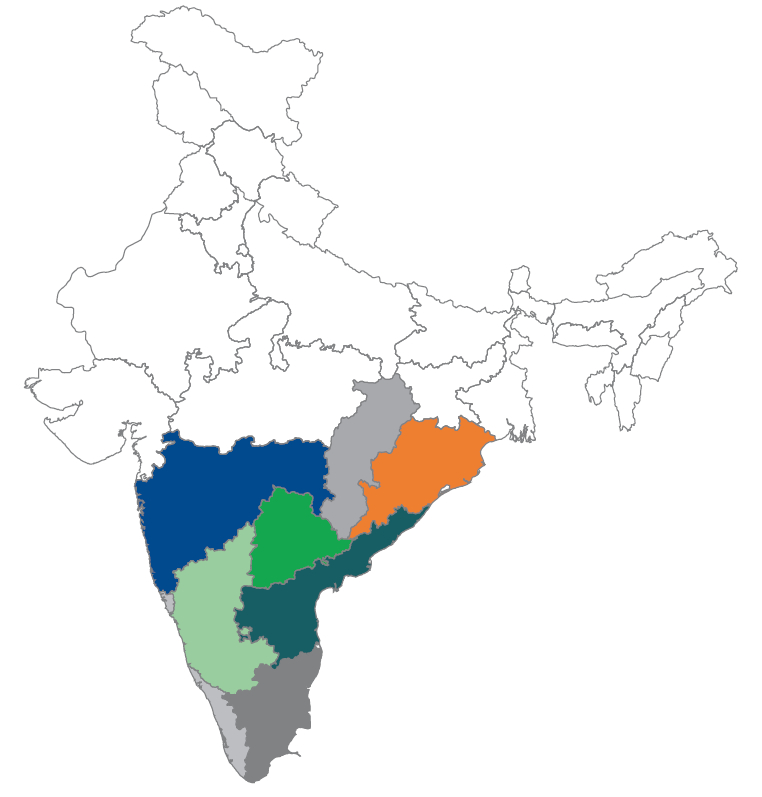
Andhra Pradesh - 10,53,244

Telangana - 7,88,223

Karnataka - 3,28,902

Maharashtra - 2,85,560

Tamil Nadu - 3,89,255

Odisha - 2,50,598

Chhattisgarh - 19,956

Others - 15,565

Profit and loss indicators

Net sales    (` Lakhs)

FY16
FY17
FY18
FY19
FY20

4%

y-o-y

9%

5-year CAGR

EBITDA    (` Lakhs)

FY16
FY17
FY18
FY19
FY20

24%

y-o-y

8%

5-year CAGR

EBITDA margin    (%)

FY16
FY17
FY18
FY19
FY20

Profit before tax    (` Lakhs)

FY16
FY17
FY18
FY19
FY20

114%

y-o-y

Profit after tax    (` Lakhs)

FY16
FY17
FY18
FY19
FY20

95%

y-o-y

10%

5-year CAGR

PAT margin    (%)

FY16
FY17
FY18
FY19
FY20

Shareholder indicators

Net fixed assets*    (` Lakhs)

FY16
FY17
FY18
FY19
FY20

10%

y-o-y

9%

5-year CAGR

* Includes goodwill

Average capital employed    (` Lakhs)

FY16
FY17
FY18
FY19
FY20

9%

y-o-y

10%

5-year CAGR

Average Return on Capital Employed (RoCE)    (%)

FY16
FY17
FY18
FY19
FY20

Earnings per share    (`)

FY16
FY17
FY18
FY19
FY20

86%

y-o-y

13%

5-year CAGR