SDGs impacted
Sagar Cements has pledged to become Net Zero by the year 2050. Efforts are in full swing to achieve this milestone by minimising carbon footprint and maximising resource efficiency. Multiple initiatives are underway, while several more are planned to accomplish this goal.
Focus areas
 Energy
 Emission
 Water
Water Waste management
 Resources
 Biodiversity
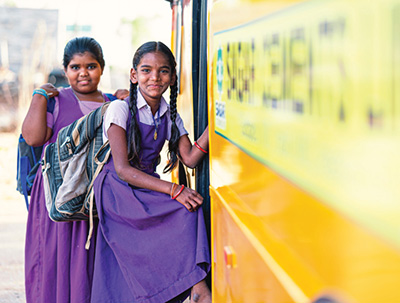
SDGs impacted
Having trusted relationships with each stakeholder group is essential for us to grow as a brand. Everyone including our employees, customers, partners and community members expect to have a rewarding association with us and that increases our responsibility to enhance value generated for them.
Focus areas
 Employee well-being
 Health and safety
 Suppliers and partners
 Communities
Fairness, transparency, and equity are the pillars of corporate governance at Sagar Cements. These values are imbibed in our day-to-day functioning and allow us to create long-term value for all our stakeholders.
Focus areas
 Corporate governance practices
 Transparency and stakeholder engagement
 Ethics and compliances
![]() 40% YoY
40% YoY
![]() 44% decline YoY
44% decline YoY
![]() 86% decline YoY
86% decline YoY
![]() 32% YoY
32% YoY
![]() 22% YoY
22% YoY
(61% in FY22)
![]() 105% YoY
105% YoY
91 Ltr/Ton in FY22
3,76% in FY22
![]() YoY growth
YoY growth
![]() YoY decline
YoY decline
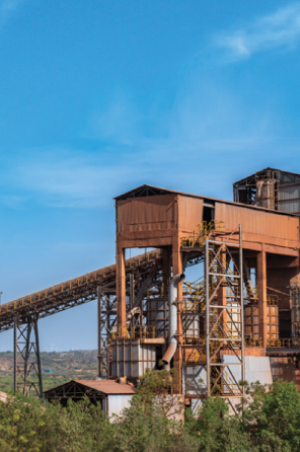
Sagar Cements is a leading cement manufacturer in India with a strong presence in the Southern markets and expanding footprint in the Central and Eastern parts of the country.
Know more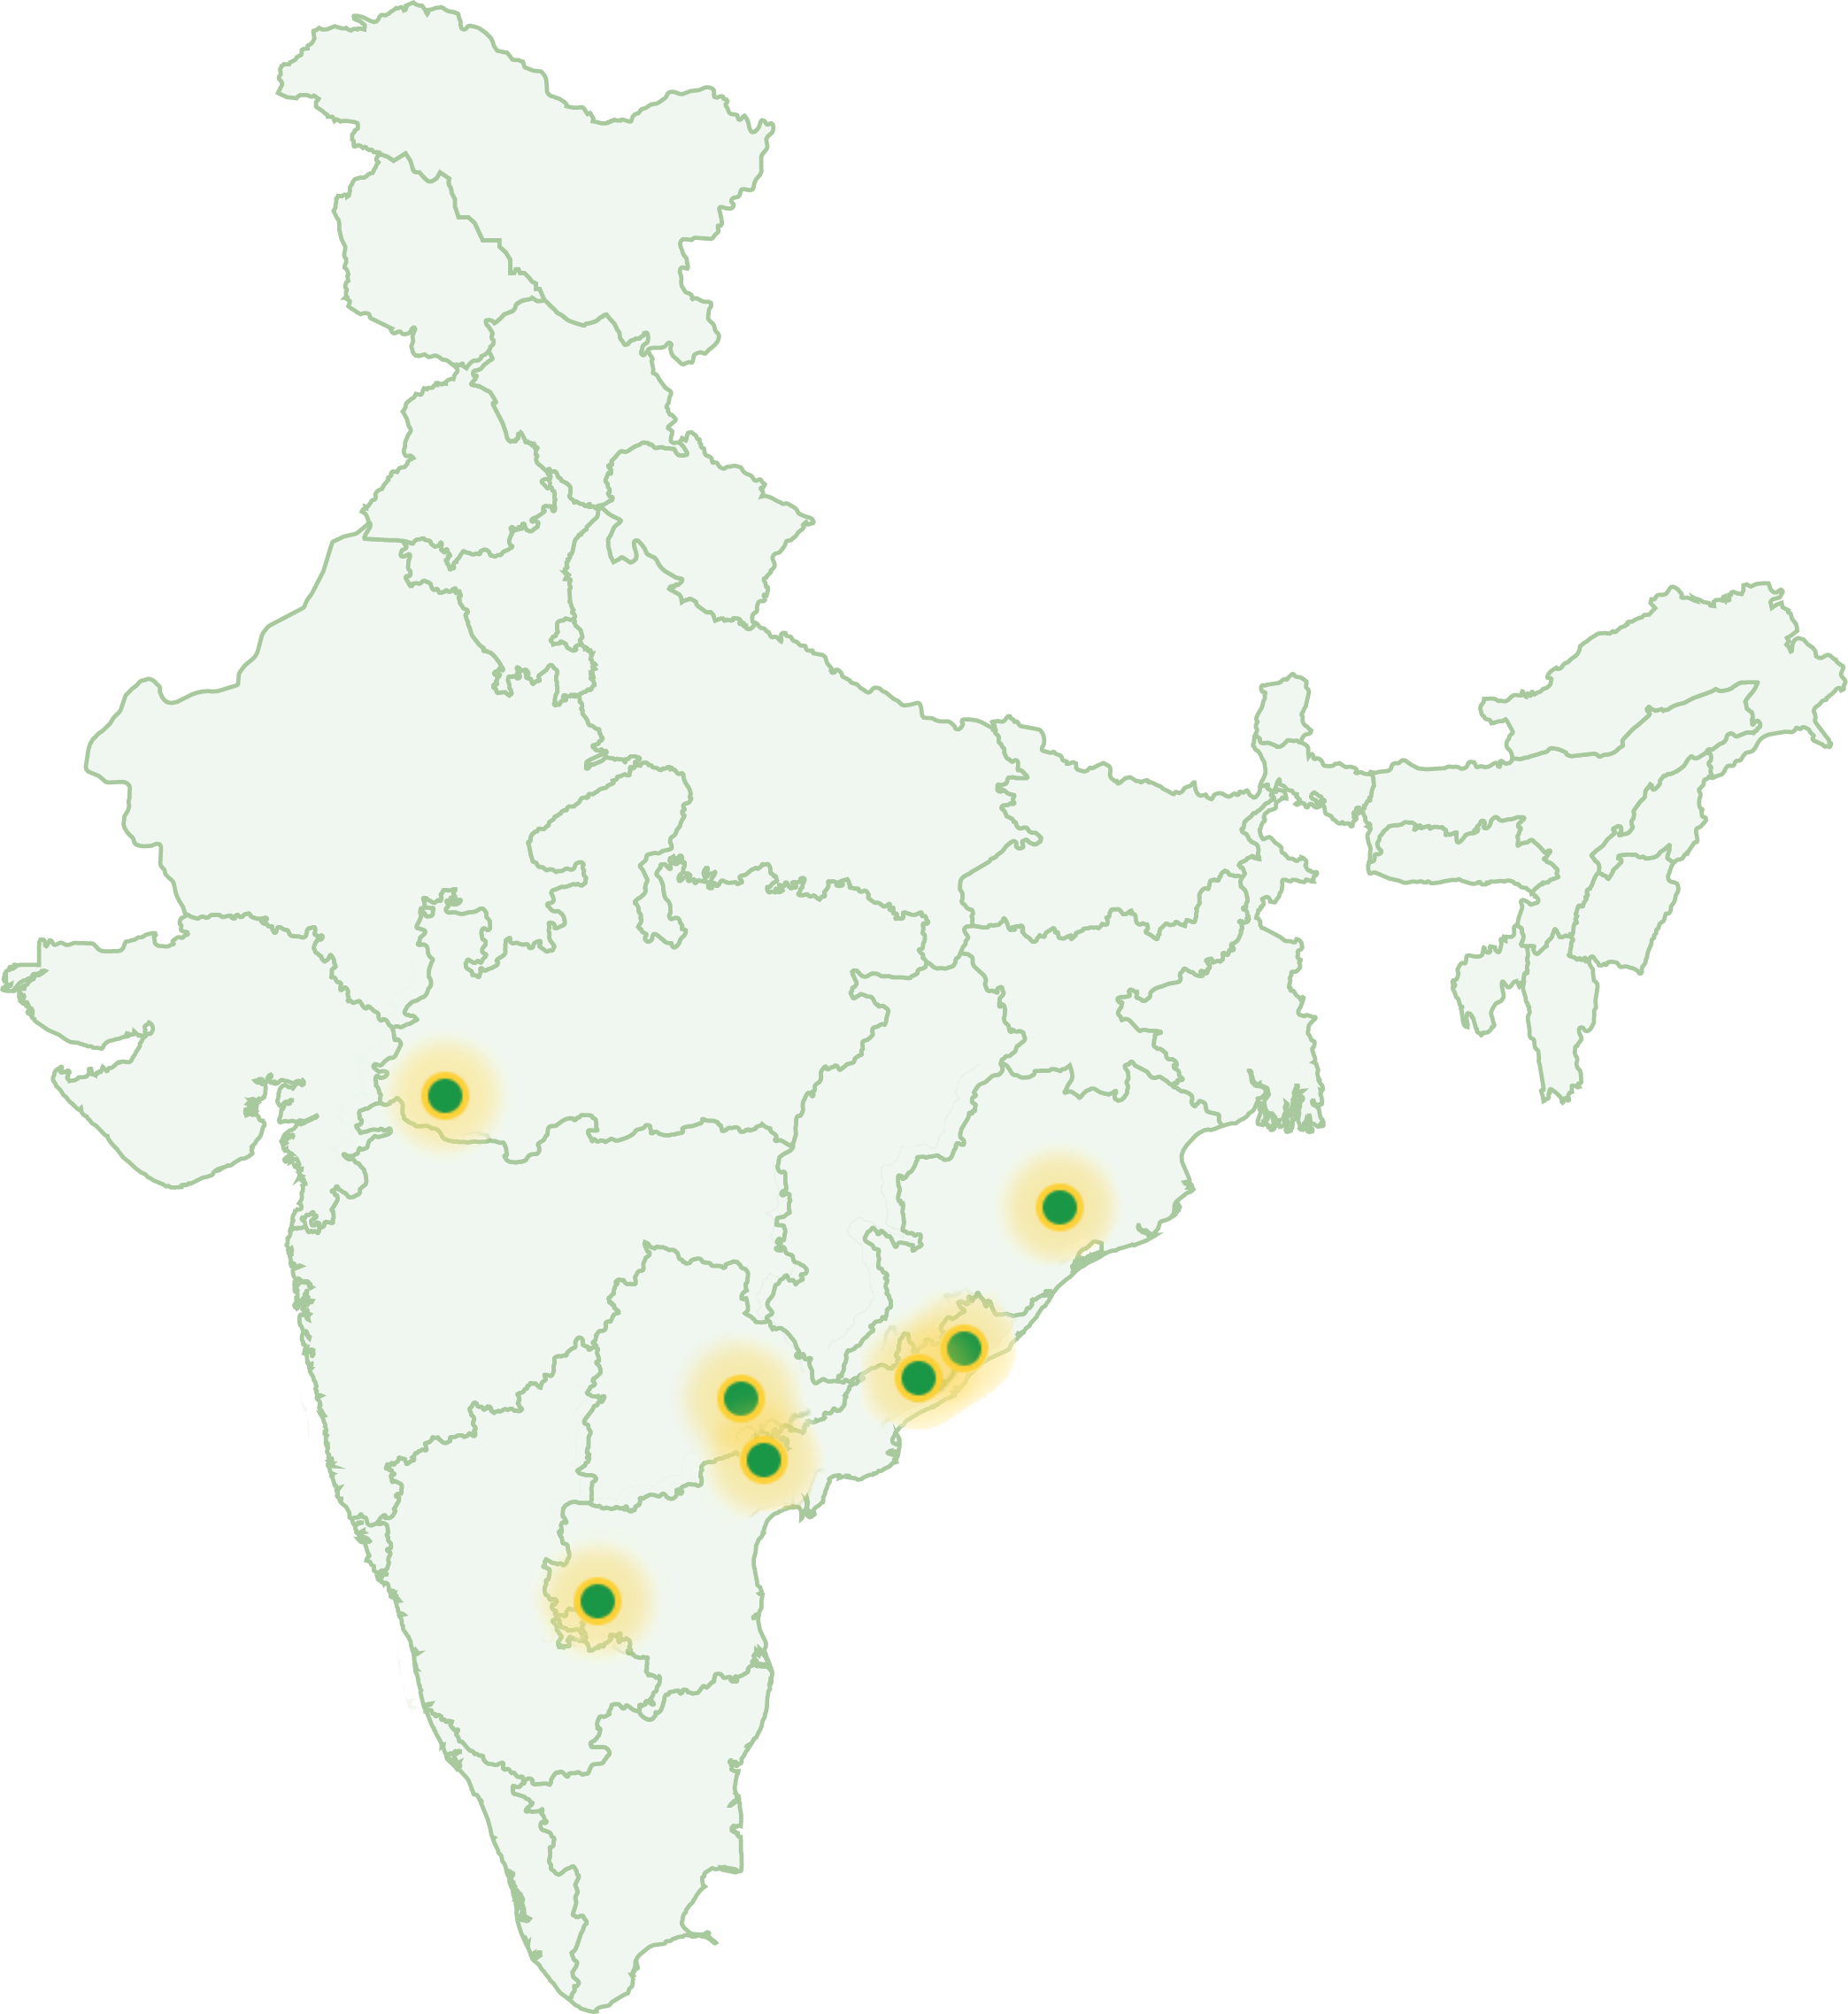
Jeerabad, Madhya Pradesh
Mattampally, Telangana
Gudipadu, Andhra Pradesh
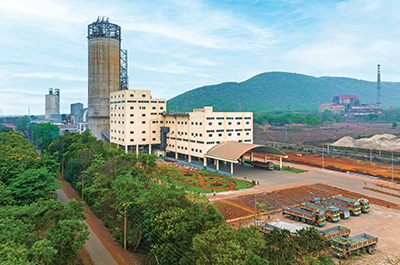
Jajpur, Odisha
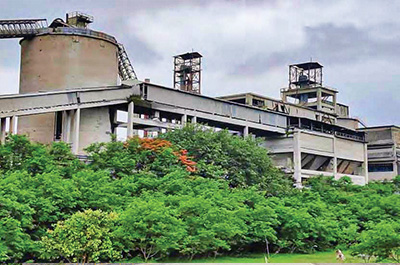
Visakhapatnam, Andhra Pradesh
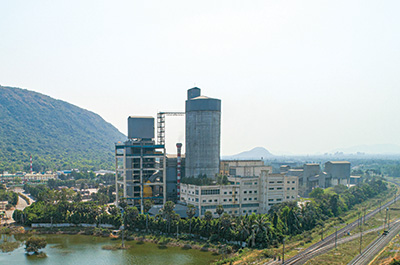
Bayyavaram, Andhra Pradesh
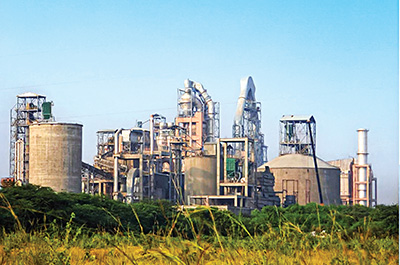
Dachepalli, Andhra Pradesh
We have been undertaking a host of initiatives across various ESG parameters. We believe integrating sustainability objectives into
![]() YoY growth
YoY growth
![]() 5-year CAGR
5-year CAGR

As Sagar Cements continues to grow at a significant pace, capturing new markets and implementing innovative practices across the Board, it becomes a strategic imperative to assess performance and progress through the sustainability lens."
![]()
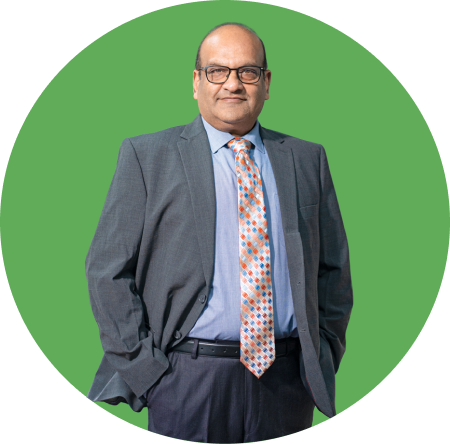
Chairman
Know more

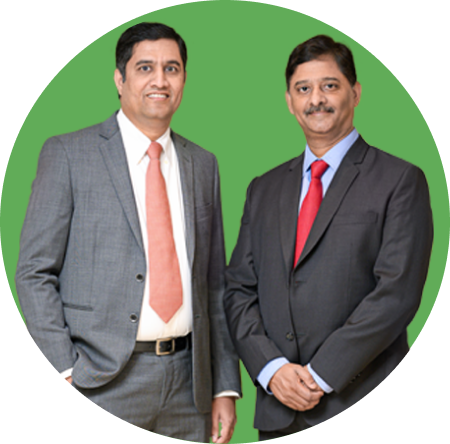
FY2023 has been a year of strategic growth for us at Sagar Cements. We launched our ESG Vision and Roadmap which lays out our 2030 and 2050 targets while we are also adding to our overall geographic presence, gaining market access, and enhancing production capacity, all in a sustainable manner."
![]()
Md and JMD
Read More

Financial capital
Manufactured capital
Intellectual capital
Human capital
Social and relationship capital
Natural capital
Pool of funds allocated and utilised for all business activities.
Total Equity: ` 1,68,893 Lakhs
Total Debt: ` 1,47,212 Lakhs
Capital commitment as on Mar 2023: ` 8,563 Lakhs
Assets built or owned that facilitate production, storage and delivery of goods.
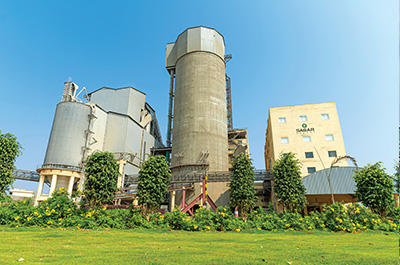
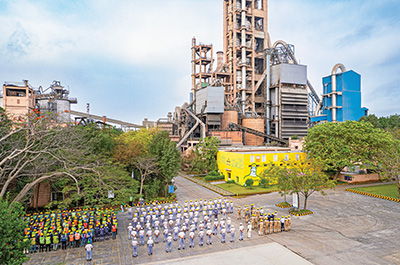
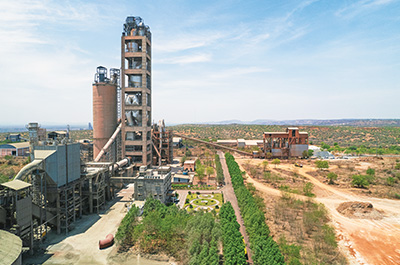
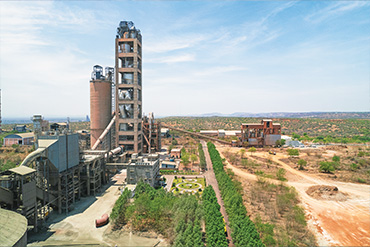
Cement and grinding plants: 7
Captive power plants: 3
Hydro power plants: 2
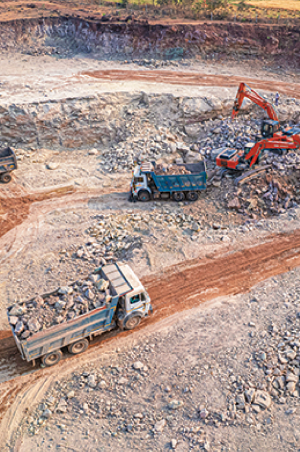
Limestone resources: 828.10 MnT
Organisation’s all intangible assets that contributes to its bottom line.
R&D investment: ` 30 Lakhs
Digitisation cost: ` 59 Lakhs
Use of robotics in plant operations: 4.0
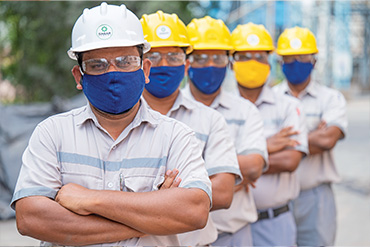
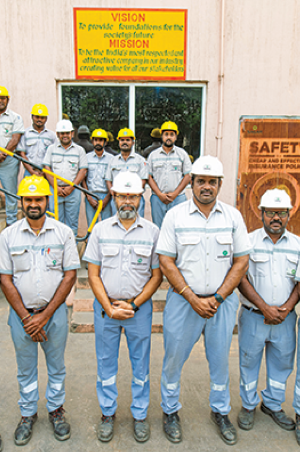
Talent acquired and nurtured to manage all business activities.
Employee strength: 2,907
Total employee expense: ` 9,934 Lakhs
Total training hours: 52,390
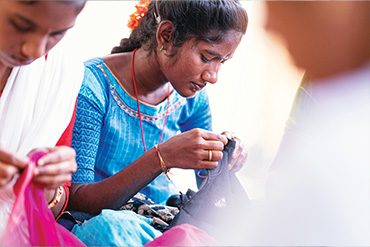
Building trusted partnerships with key stakeholder groups.
CSR Spent: ` 306 Lakhs
Distributors/Dealers: 2,675
Resources provided by the natural world that are impacted due to business operations.
Total Energy consumed 10,811 TJ
Limestone Mined 4.92 MnT
Slag consumed 0.36 MnT
Gypsum consumed 0.15 MnT
Fly ash consumed 0.58 MnT
Coal Consumed 0.48 MnT
Fresh water withdrawal 2 44 441 KL
Human resources and administration
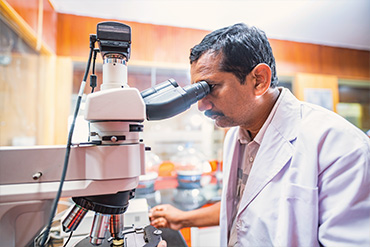
Research and development
Secretarial and legal
Finance and accounts
Energy management
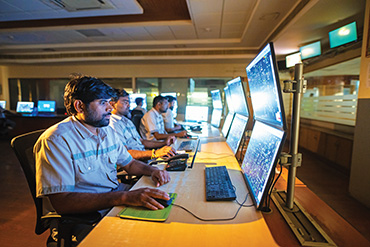
IT and digital
Quality
Environment management
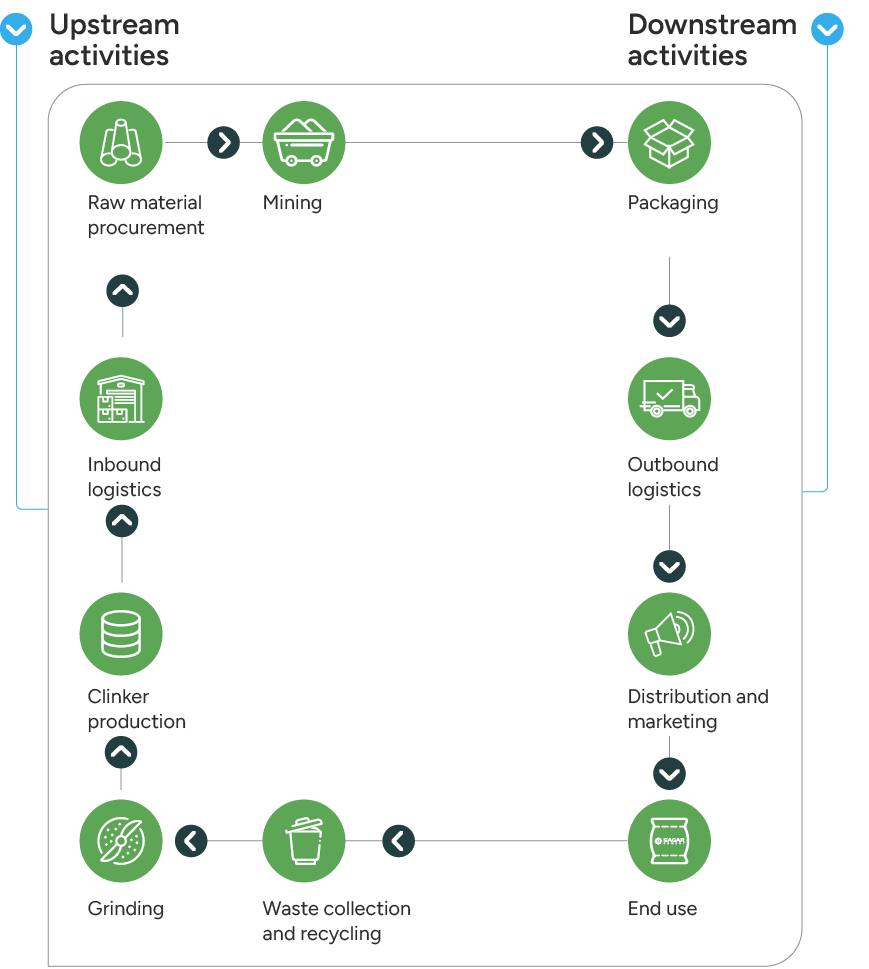
Ordinary Portland Cement (OPC)
Portland Pozzolana Cement (PPC)
Portland Slag Cement (PSC)
Sulphate Resistant Cement (SRC)
Composite Cement (CC)
Ground Granulated Blast-furnace Slag (GGBS)
Clinker Production
Steel scrap
Tyres, oil, grease and others
Financial capital
Manufactured capital
Intellectual capital
Human capital
Social and relationship capital
Natural capital
Revenue: ` 2,22,954 Lakhs
PAT: ` 850 Lakhs
RoCE: 8%
Dividend: 35%
Market Capitalisation: ` 2,48,018 Lakhs
Capacity utilisation: 58%
Clinker factor: 75%
Production of high margin products:50%
New products launched: 2
Blended cement produced: 22,86,946 MT
Process improvement achieved – TSR ratio, blended cement volumes:23,83,242 MT
LTIFR: 1.6
Retention rate: 83.47%
Fatalities: 0
Employee productivity: 0.67 ton/manhour
Training hour: 52,390
CSR beneficiaries: 69,629
Number of complaint received: NA
Number of complaint resolved: NA
India ratings: IND A/Stable
Contribution to exchequer: ` 79,228 Lakhs
Total Waste recycled: 10,24,507 MT
Total Water recycled: 80,653 KL
Waste to landfill: 0 MT
Water positive: 6.8 times
Vision and Mission
Human resources and administration
Research and development
Secretarial and legal
Finance and accounts
Energy management
IT and digital
Quality
Environment management
Outcomes
Revenue: ` 2,22,954 Lakhs
PAT: ` 850 Lakhs
RoCE: 8%
Dividend: 35%
Market Capitalisation: ` 2,48,018 Lakhs
Capacity utilisation: 58%
Clinker factor: 75%
Production of high margin products:50%
New products launched: 2
Blended cement produced: 22,86,946 MT
Process improvement achieved – TSR ratio, blended cement volumes:23,83,242 MT
LTIFR: 1.6
Retention rate: 83.47%
Fatalities: 0
Employee productivity: 0.67 ton/manhour
Training hour: 52,390
CSR beneficiaries: 69,629
Number of complaint received: NA
Number of complaint resolved: NA
India ratings: IND A/Stable
Contribution to exchequer: ` 79,228 Lakhs
Total Waste recycled: 10,24,507 MT
Total Water recycled: 80,653 KL
Waste to landfill: 0 MT
Water positive: 6.8 times
 INTEGRATED REPORT
2022-23
INTEGRATED REPORT
2022-23