Revenue
` 2,50,461 Lakhs
 12%
12%
EBITDA
` 24,591 Lakhs
61%
Positive transformation of the environment around us; the people amidst us; and the conduct among us.
Revenue
12%
EBITDA
61%


We believe digitalisation enhances organisational efficiency, giving us a competitive edge. We have implemented it across key processes like sales, logistics, material management, manufacturing, and technology operations. Our dedicated workforce is integral to our success, and we prioritise their health, safety, and overall satisfaction."
Chairman
Know moreNext
 MD and JMD's message
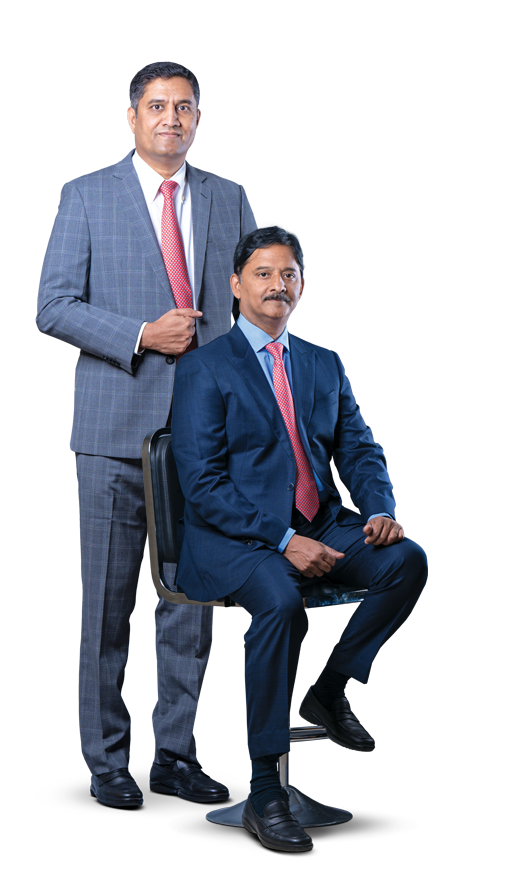
To facilitate strategic planning and alignment, we have developed an ESG calendar, ensuring that our initiatives are integrated into our business strategy and operations seamlessly."
MD and JMD
Know morePrevious
 Chairman's message


 17%
6%
20%
(18%)
(9%)
17%
17%
6%
20%
(18%)
(9%)
17%
![]() YoY growth
5 year CAGR
YoY growth
5 year CAGR
12%
13%
![]() YoY growth
5 year CAGR
YoY growth
5 year CAGR
Pool of funds allocated and utilised for all
business activities.
Total Equity: ` 2,01,969 Lakhs
Total Debt: ` 1,44,188 Lakhs
Capital commitment as on March 31, 2024: ` 42,061 Lakhs
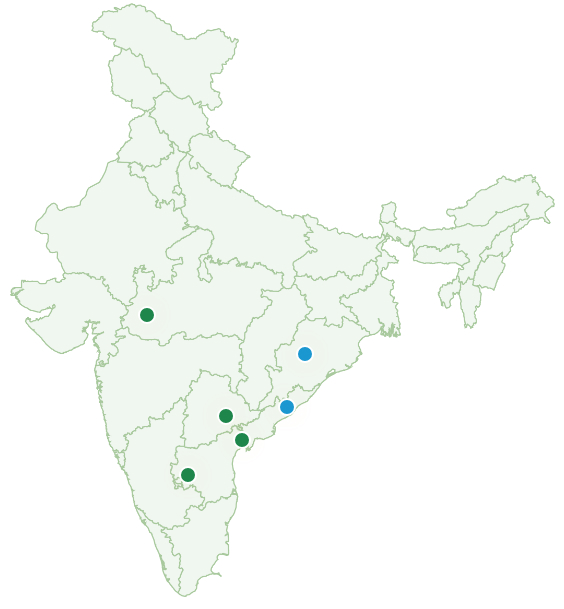
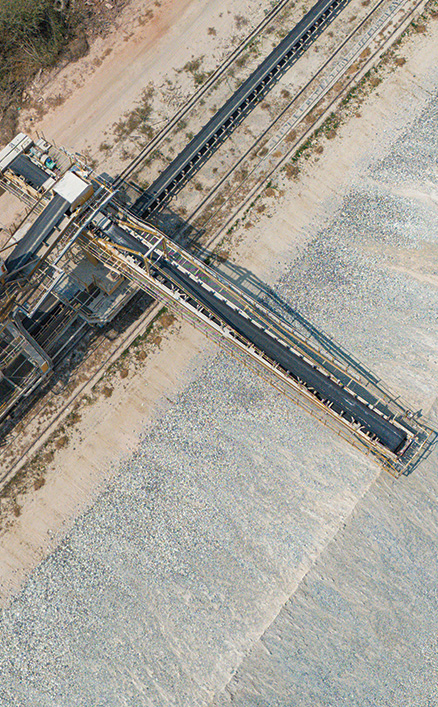
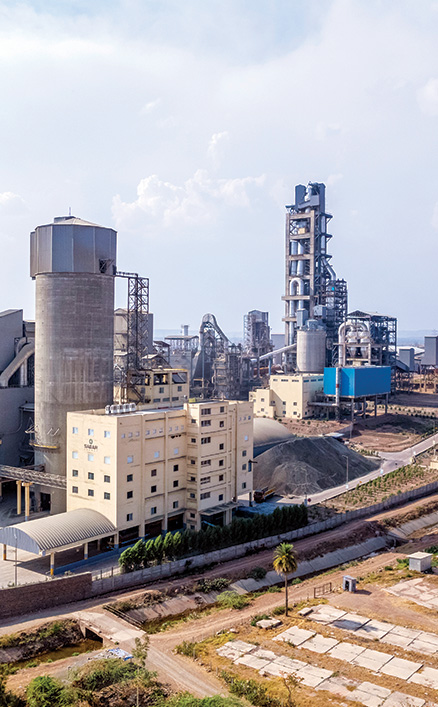
Assets built or owned that facilitate production,
storage and delivery of goods.
Cement and grinding plants: 6
Thermal power plants: 3
Hydro power plants: 2
Limestone resources: 943.75 MnT
Organisation's all intangible assets that
contributes to its bottom line.
R&D investment: ` 40 Lakhs
Digitisation cost: ` 50 Lakhs
Use of robotics in plant operations: 4
Talent acquired and nurtured to manage all business activities.
Employee strength: 1,189
Total employee expense: ` 11,730 Lakhs
Total training hours : 34,009
Building trusted partnerships with key stakeholder groups.
CSR Spent: ` 290.11 Lakhs
Distributors/Dealers: 3,055
Resources provided by the natural world that are impacted
due to business operations.
Total Energy consumed 15,212 TJ
Limestone Mined 7.31 MnT
Slag consumed 0.53 MnT
Gypsum consumed 0.14 MnT
Fly ash consumed 0.70 MnT
Coal consumed 0.50 MnT
Fresh water withdrawal 2,68,914 KL
Human resources and administration
Research and development
IT and digital
Secretarial and legal
Finance and accounts
Quality
Energy management
Environment management
Ordinary Portland Cement (OPC)
Portland Pozzolana Cement (PPC)
Portland Slag Cement (PSC)
Sulphate Resistant Cement (SRC)
Composite Cement (CC)
Ground Granulated Blast-furnace Slag (GGBS)
Clinker production
Steel scrap
Tyres, oil, grease and others
Revenue growth 12%
Dividend 35%
RoCE 3%
OPC, PPC, PSC, GGBS, CC and SRC to meet customer demand
Strengthened long-standing relationship with marquee clients
Cement produced 54,72,855 MT
Capacity utilisation 53%
LTIFR 1
Retention rate 84.16%
Average training hours 22.91
Employee productivity 2.22 Tonnes/FTE
Vendor engagements 742
Vendors 12,181
Procurement from local suppliers 35%
CSR Beneficiaries 1,07,865
Contribution to the exchequer ` 80,668 Lakhs
Reduction in GHG emissions 3.28%
Total Waste recycled 13,99,196 MT
Total Water recycled 1,16,515 KL
Water positive 3 times
Vision Chain
Human resources and administration
Research and development
Secretarial and legal
Finance and accounts
Energy management
IT and digital
Quality
Environment management
 Energy
The process of cement manufacturing is highly energyintensive. Hence, it is crucial to implement state-of-the-art energy management practices and effective efficiency measures to contribute to a low-carbon economy, minimising the impact on climate change. SGC has been a pioneer in embracing newer and innovative technologies with the goal of enhancing efficiency.
1,52,11,513 GJ
Total energy consumption
4,07,940 MWh
Non-renewable energy consumption
49,248 MWh
Waste heat recovered
 Emissions
Producing cement and concrete with lower carbon emissions involves not only advancing new technologies but also enhancing the effectiveness of proven methods. Leveraging our knowledge and experience, we aim to efficiently recover energy from alternative fuels and increase the utilisation of co-processing materials from various sectors in our cement plants.
677 Kg CO2/tonnes of cementitious
GHG intensity
232 MT
SOx emission
2,820 MT
NOx emission
 Resources
We are mindful of the fact that the effective use of natural resources is core to its business sustainability strategy. By substituting traditional fossil fuels with alternative fuels, we conserve natural resources, reduce CO2 emissions, deliver financial proficiencies, and support the circular economy.
73,14,201 MT
Limestone mined
5,90,611 MT
Fuel consumed
1,41,939 MT
Gypsum consumed
 Water
WaterFreshwater is vital for sustaining vibrant communities, thriving businesses, and natural ecosystems. It is imperative that we use it judiciously to safeguard water resources for the enduring prosperity of our operations, the local environment, and the communities that depend on it.
8,99,112 KL
Total water withdrawn
1,16,515 KL
Total water recycled/ reused
155 L/tonnes
Cementitious water intensity
 Waste
WasteWe believe waste is a potential material that can begin a new cycle of production. Our efforts are directed towards improving waste management across our value chain. We practice waste minimisation, wherever practically possible.
40.8 MT
Hazardous waste generated
66,687 MT
Non-hazardous waste generated
71.5 MT
Plastic waste generated
 Biodiversity
As a large-scale landholder, our approach to the preservation of land and protecting biodiversity is an integral part of the way we operate. We strive to improve natural habitats and encourage a culture of appreciation and respect for biodiversity across our locations.
33%
Company premises are fully compliant with CPCB guidelines
Actively participating in 'Harita Haram'
Telangana government initiative for afforestation
 Employee well-being
At SGC, we offer all our members a defined talent value proposition to challenge, enrich and fulfil their aspirations so that they can maximise their true potential to 'make a difference'.
321
New employees hired
84.16 %
Retention rate
34,009
Total training hours
 Health and safety
At SGC, we put safety first, as demonstrated by our values and our declared ambition to achieve zero harm. Our culture of safety sets us apart and is driven by employees and management at every level as we work to achieve our common goal – that nobody gets hurt at work.
 Suppliers and partners
Our goal is to offer customers the solutions they need to deliver a sustainable built environment. We aim to develop a world-class sustainable procurement approach that ensures our businesses are equipped to implement and manage a sustainable supply chain.
 Communities
We seek to contribute generously and responsibly for the well-being of the communities in which we operate. We aim to remain a corporation that gives back, to uplift and enhance the lives of our neighbours.
 Corporate governance practices
We aim to achieve optimal governance practices by formalising various policies and standards that safeguard human rights while fostering ethical conduct.
 Transparency and stakeholder engagement
At SGC Limited, we consistently foster meaningful dialogues with our stakeholders to comprehend their expectations.
 Ethics and compliances
Enforcement systems are always on the vigil to prevent, control, mitigate and eliminate corrupt practices, including bribery, fraud, embezzlement, concealment, and trading in influence.
Know more